La Niña is back. What does that mean for a parched Southern California?
La Niña is back for an encore — but few Californians are likely to applaud this chilly diva.
Since La Niña typically results in a drier-than-average winter in drought-afflicted Southern California, this isn’t exactly welcome news. The condition, which influences weather across the United States, has been developing since summer and has already played a part in an above-normal Atlantic hurricane season this year.
La Niña is essentially the opposite of her warm and wet counterpart, El Niño, and is characterized by below-average sea surface temperatures in the central and east-central equatorial Pacific. Forecasters predict that this La Niña will be moderate in strength, and give it an 87% chance of persisting from December to February, according to the National Oceanic and Atmospheric Administration’s Climate Prediction Center.
This is the second consecutive winter that this phenomenon has developed.
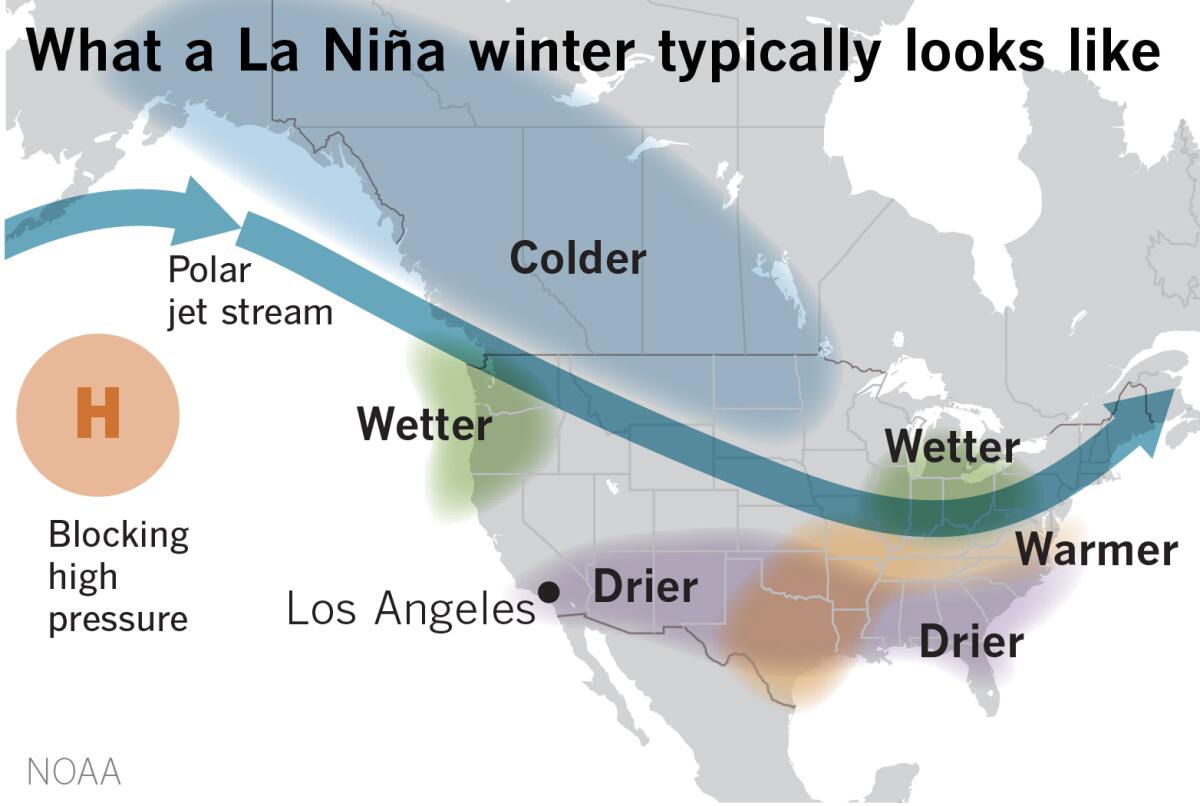
What is La Niña?
In addition to below-average sea surface temperatures in the tropical Pacific, easterly winds over that region strengthen, and rainfall usually decreases over the central and eastern tropical Pacific and increases over the western Pacific, Indonesia and the Philippines.
La Niñas usually weaken wind shear in the Caribbean and tropical Atlantic, contributing to increased hurricane activity in the Atlantic Basin.
What does that mean for Southern California?
There are numerous global climate factors involved in predicting precipitation, but La Niñas are typically associated with colder, stormier-than-average conditions and increased precipitation across the northern parts of the United States, and warmer, drier and less stormy conditions in the southern portions of the country.
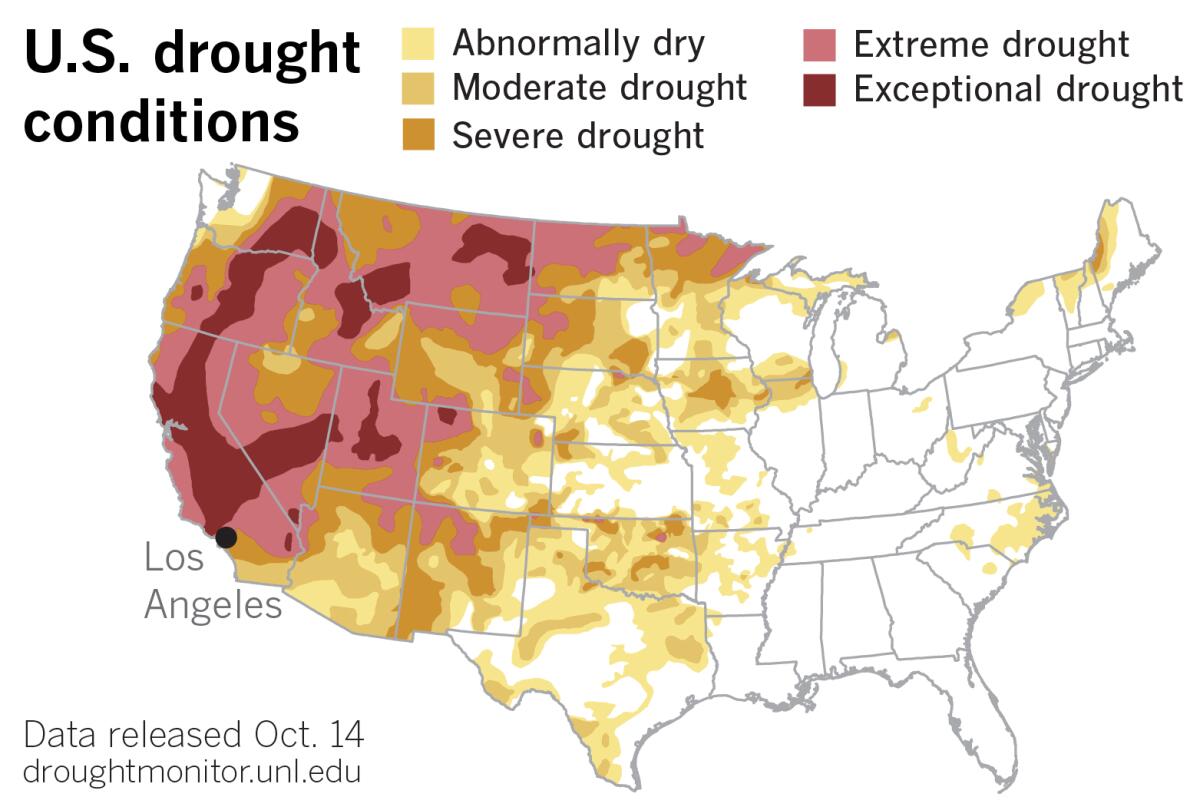
California and much of the West continues to be gripped by extreme or exceptional drought, according to the most recent U.S. Drought Monitor data. The region needs precipitation to recharge soil moisture and increase groundwater levels, stream flows and reservoir levels, according to the Drought Monitor’s scientists.
This is especially true after a summer characterized by extreme heat — California’s hottest summer ever recorded, in fact.
Climate scientist Daniel Swain tweeted on Wednesday that California’s current drought is worse than the one in 2014-15, making it the worst drought on record since the late 1800s.
Are La Niña winters always dry?
The short answer is, not necessarily.
But Bill Patzert, a retired climate scientist at NASA’s Jet Propulsion Laboratory who has studied the El Niño-Southern Oscillation (ENSO) for four decades, says the deck is probably stacked for another dry year.
The ENSO climate phenomenon has three phases: El Niño, a warming of the ocean surface; its opposite, La Niña, which is a cooling of the ocean surface; and a neutral phase in between. These ocean temperature changes are coupled with changes to the atmosphere and winds.
Patzert uses annual rainfall figures (July to June) for downtown Los Angeles to represent Southern California, since the downtown figures go back the furthest. El Niño and La Niña were not well documented before 1950, so he looked at the 72 rainfall years through 2021. So that’s 1949-50 through 2020-21. (Rainfall years refer to the year that it ended.)
During that time, there were 25 La Niñas and 26 El Niños — so they occurred with about equal frequency.
The average rain for La Niña years is 11.64 inches. The long-term average dating back to 1878 in downtown L.A. is just shy of 15 inches. Last winter, during a moderate La Niña, downtown got only 5.82 inches.
In 10 of the 25 La Niña years, downtown received less than 10 inches, so some of L.A.’s driest years come during La Niñas. In only four La Niña years has downtown L.A. received above-average precipitation. So it’s rare, but it can happen. The wettest La Niña year was 2011, when downtown scored 20.20 inches of rain. In 2017, 19 inches of rain fell downtown, and that was during a weak La Niña. In 2016, only 9.6 inches fell, and that was during a strong El Niño.
Repeating La Niñas are not uncommon, and occurred most recently in the years 1973-74-75, 1998-99-200 and in 2007-08-09. Repeating La Niñas often follow El Niños.
So El Niños and La Niñas can be pretty unpredictable, Patzert says, “But the statistics favor drier La Niñas and wetter El Niños, which is not good news for water managers, farmers and firefighters.”
How do scientists study La Niñas?
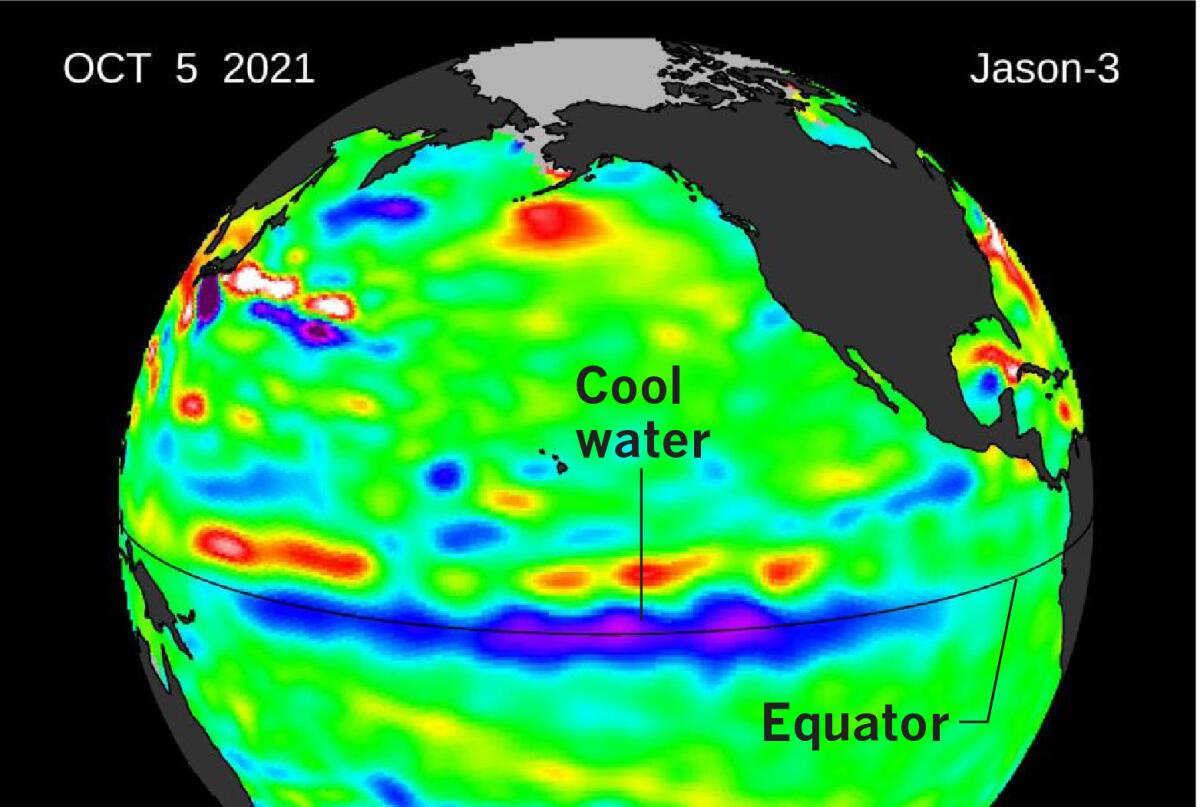
Scientists at JPL in La Cañada Flintridge study the ENSO phenomenon with satellite technology that detects the height of waters in the Pacific Ocean.
Since water expands when it’s warmer, the surface of the ocean is higher. Where water is colder, it contracts, and the surface is lower. (In satellite imagery, taller-than-normal heights are shown in yellow and red, while lower heights are shown in blue and purple. Green indicates what is close to normal.)
Currently, the cooler La Niña water along the Equator measures between 3 and 6 inches lower than normal.
So, as the record shows, there are no guarantees, but “conditions are ripe for a stormy, wet winter in the Pacific Northwest and a dry, relatively rainless winter in Southern California, the Southwest and the southern tier of the United States,” says Patzert.
ENSO is still not fully understood, and numerous other factors play a role in global climate, but the Pacific Ocean is the 800-pound gorilla of climate factors. As Patzert likes to say, “When the Pacific speaks, we all should listen.”
More to Read
Sign up for Essential California
The most important California stories and recommendations in your inbox every morning.
You may occasionally receive promotional content from the Los Angeles Times.
