California still highly segregated by race despite growing diversity, research shows
Even as Los Angeles and other American cities have become more racially diverse over the last few decades, segregation and the inequities that go along with it have changed little, according to new research from UC Berkeley.
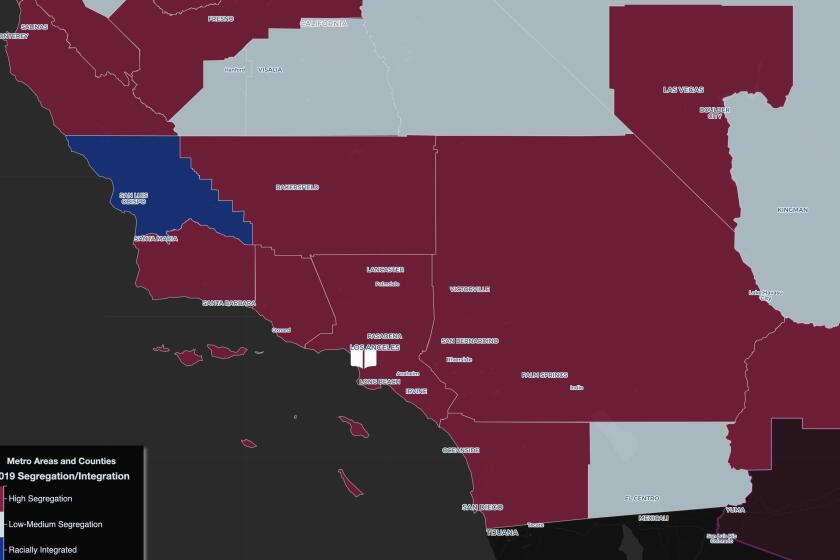
The Los Angeles metropolitan area has seen only slight improvements, the study found, and remains the sixth-most segregated of the 221 metro areas. Some other regions of the state ranked in the study did even worse. The metropolitan regions of Santa Cruz, Santa Rosa, Santa Barbara, San Jose, Riverside, Sacramento, Oxnard, Vallejo, San Diego, Modesto, Chico, San Luis Obispo, Bakersfield and San Francisco all saw their segregation numbers worsen, the study found.
The Roots of Structural Racism Project was unveiled this month after several years of investigation, researchers said. Its findings are stark: 81% of U.S. metropolitan regions with at least 200,000 residents were more segregated in 2019 than they were in 1990.
New York, Chicago and Milwaukee were the most segregated metropolitan regions, while the Midwest and mid-Atlantic were the most segregated areas of the country, followed by the West Coast.
Critically, the study also found that key outcomes for residents in segregated communities — including income, home values and life expectancy — remain worse than those in more integrated areas.
The findings were significant because residential segregation is the undercurrent of “basically every expression of structural racism” in the country, from health disparities to overpolicing, said Stephen Menendian, assistant director of the Othering & Belonging Institute at UC Berkeley and the study’s lead author.
“The focus of the report is the persistence and extent of racial residential segregation,” he said, “and the harms that flow therefrom.”
The researchers used 1990 as a baseline year for comparison, not because it marked a particular turning point, Menendian said, but because that was when the U.S. Census Bureau started gathering more specific data on the Hispanic and Latino population.
Previous studies of segregation were more focused on the binary of Black people and white people, he said. Introducing additional populations into the data helped form a new and more complete picture.
“That’s what segregation looks like today,” he said. “It’s not about the complete separation of people. It’s about the divergence of the quality of neighborhoods and the composition of neighborhoods across regions.”
And even though Los Angeles has become more diverse over the last three decades, it is barely more integrated today than it was then. The L.A. metropolitan area — which includes Long Beach and Santa Ana, according to the census area used in the data — recorded a 0.01-point improvement on the researchers’ index, meaning it has seen virtually no change in 30 years.
“The decline [in segregation] is basically negligible,” Menendian said. Los Angeles “is essentially as segregated as it was in 1990.”
George Sanchez, a professor of history as well as American studies and ethnicity at USC, said he wasn’t surprised to hear that little has changed in the last three decades.
The historical legacy of segregation in Los Angeles still holds weight in many of today’s housing policies, Sanchez said, and while gentrification may temporarily integrate communities, they are typically resegregated by the new white or wealthy populations in due time.
“If you’ve been here 50 years, it seems like L.A. is amazingly diverse,” he said, “but of course, if you’ve got wealth and the right skin color, you’ve been able to cross over those lines on a very consistent basis. It looks very different when you’re low-income and trying to find a place to live.”
Along with Los Angeles, Stockton and Fresno were the only California areas in the study to see any improvement.
The U.S. metropolitan regions that saw the biggest increase in segregation between 1990 and 2019 included the Fayetteville, Ark., metropolitan region, and the Pennsylvania regions of Reading, Scranton and Allentown, according to the report.
Mapping race in America
Los Angeles was no utopia in 1990. The L.A. riots — spurred by the acquittal of four police officers in the beating of Rodney King — were on the horizon.
One Times story from 1992 began: “Despite evidence of increased racial tensions across the nation, [B]lack and white Americans still support the concept of a racially mixed society, especially integrated schools, according to a recent study.”
But many of the patterns that persisted then — as well as today — were knit much earlier.
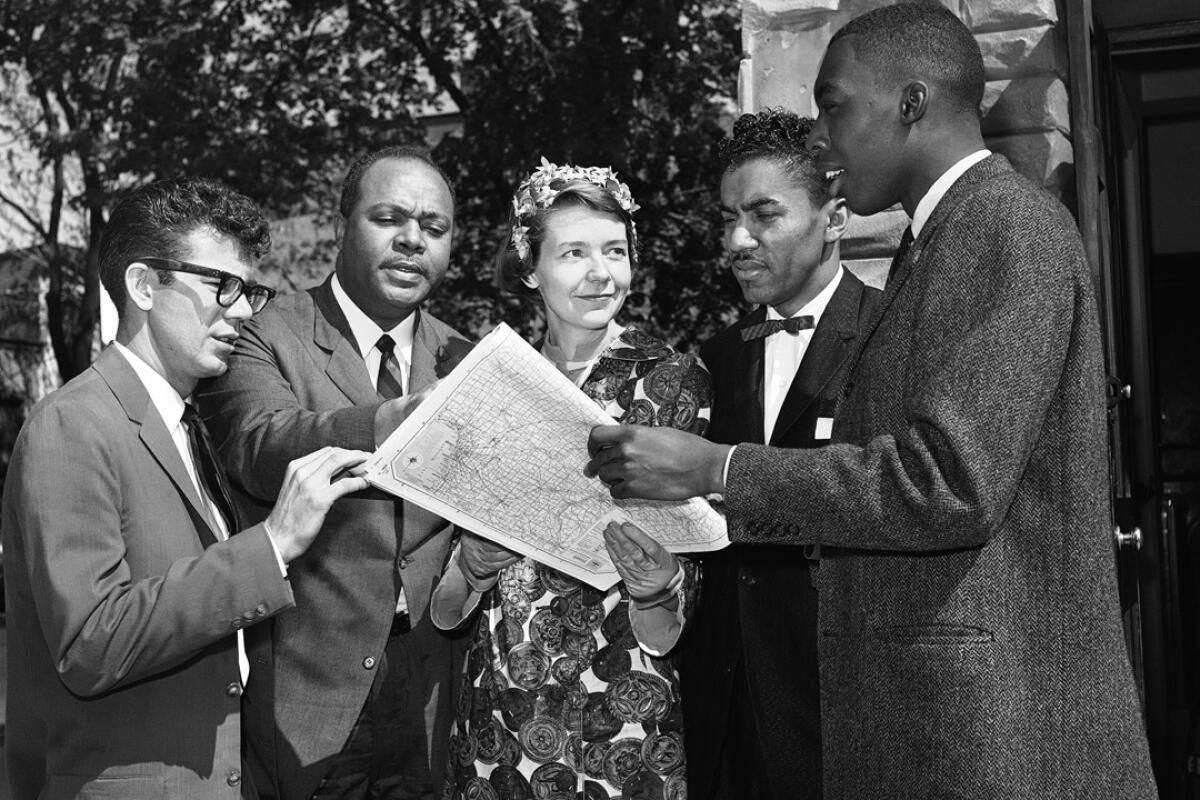
The practice of redlining, which denied home ownership and financial services to residents based on race, began around the 1920s, historian Alison Rose Jefferson said. By the 1930s, the government-sponsored Home Owners’ Loan Corp. had codified redlining practices, creating a domino effect of decline for those who had been marginalized.
“It’s a vicious cycle in terms of what was done to our society during that time period because it allowed for a major level of disinvestment of communities of color and lower-income white communities,” she said, noting that translated into a lack of housing development and new infrastructure, the laying of freeways through neighborhoods and other lasting harms.
There was progress along the way, including the Shelley vs. Kraemer decision of 1948 that made racially restrictive covenants — which barred Black, Latino and other people of color from living in certain homes — unenforceable by law. In 1968, the Fair Housing Act expressly prohibited housing discrimination based on race.
From 1970 to 1980, residential integration in many areas increased significantly, according to the Berkeley report, but progress slowed incrementally in each subsequent decade.
And while many of the patterns of segregation can be traced back to redlining, it is not the only driver. Residential segregation has been “sustained by exclusionary white neighborhoods and cities that make it very difficult for people of color and lower-income people to move in,” Menendian said.
According to the report, the outcomes for residents of those segregated areas can be lasting. Income for Black and Latino residents is higher in more integrated neighborhoods, and poverty rates are significantly lower.
Specifically, the study found that Black children raised in integrated neighborhoods earn nearly $1,000 more per year as adults than those raised in highly segregated communities of color, and $4,000 more when raised in white neighborhoods.
The numbers are similar for Latino children, who earn $844 more per year as adults when raised in integrated neighborhoods, and $5,000 more when raised in white neighborhoods.
Life expectancy, homeownership, employment and education numbers also improve in integrated neighborhoods.
But the best life outcomes in all categories remain in highly segregated white areas.
Racism and racial segregation are an undeniable part of the fabric of Los Angeles — from the Native land on which the city was founded to the 1871 Chinese Massacre to the beating of Rodney King. The Times in September vowed to examine its own contribution to many of those failures.
In some ways, the COVID-19 pandemic laid bare how little progress has been made. As the coronavirus spread, Black and Latino residents suffered disproportionately from its devastating and deadly toll, in part because of a lifelong and systemic lack of access to primary healthcare.
As the county began its rollout of the COVID-19 vaccine, the same pattern revealed itself. A map of neighborhoods least likely to have received the coveted doses fit pat over a map of predominantly Black and Latino communities, which itself aligned with those historical maps of redlining.
But reversing the legacy of segregation is a slow process, said Paavo Monkkonen, associate professor at the UCLA Luskin School of Public Affairs and director of the Latin American Cities Initiative.
“There’s kind of an inertia of urban neighborhoods where people may move a lot, but usually don’t move too far away from where they are,” he said. “It’s a self-perpetuating process, where people are relegated to less attractive parts of the city, and then they’re associated with those parts of the city.”
The Trump administration in 2019 tried to undo some aspects of the 1968 Fair Housing Act, Monkkonen said, and many cities and communities are still working to develop proactive policies around fair housing and development.
Although Monkkonen was optimistic, he said many researchers aren’t convinced that 2020’s reckoning with race will significantly move the needle when it comes to segregation — particularly since the results of the 2020 census were probably skewed by intimidation tactics used against the Latino population, which will make it harder to assess data moving forward.
There were some genuine surprises in the first batch of data from the nation’s 2020 head count released this week by the U.S. Census Bureau.
And while historical patterns are persistent, the reasons that people live where they do are deep and often complex, Jefferson said. Many people live in communities where they feel comfortable, or where they have family, or where they can find housing and jobs.
Los Angeles County today is about 49% Hispanic; 26% white; 15% Asian and 8% Black, according to 2019 census data. Around 2% of the population is categorized as two or more races, and less than 1% as Native American or Islander.
Those numbers are markedly more diverse than 1990, when more than 40% of the county’s residents were white.
And although Los Angeles itself has become more diverse over the years, Jefferson said it is not surprising that the study found segregation in L.A. really hasn’t budged.
“Yes, we are more diverse,” she said, “but we are not necessarily living in more diverse communities.”
Times staff writers Ryan Murphy and Swetha Kannan contributed to this report.
More to Read
Sign up for Essential California
The most important California stories and recommendations in your inbox every morning.
You may occasionally receive promotional content from the Los Angeles Times.
