Climate report card: hot, wild and with an increasingly visible ‘human footprint’

There has been good news and bad news presented at the climate talks wrapping up in the Moroccan city of Marrakech on Friday.
The United Nations’ climate agency confirmed what scientists have been warning for months: that 2016 is “very likely” to surpass 2015 as the hottest year on record.
Moreover, the World Meteorological Organization said, there is an increasingly visible “human footprint” on the extreme weather of recent years.
Environmental activists and climate scientists said the research underscores the need to rapidly reduce emissions of heat-trapping greenhouse gasses. The news on that front was more hopeful.
Researchers from the Global Carbon Project reported that emissions of carbon dioxide from burning fossil fuels and industrial processes, a major contributor to global warming, have leveled off in the last three years.
Here is a closer look at the findings:
Just how hot is it?

Global temperatures for the first nine months of the year were about 1.2 degrees Celsius above pre-industrial levels, the WMO reported.
That is fast approaching the limit set by world leaders, who committed in Paris last year to keep global warming to well below 2 degrees Celsius above pre-industrial levels and as close to 1.5 degrees Celsius as possible.
Some scientists believe world temperatures could exceed the 1.5-degree threshold as soon as 2030 and say time to change course is running out.
Temperatures were especially warm in the early months of the year because of a powerful El Niño event, the WMO said. But preliminary data for October suggested that the figures remained sufficiently high to set a new record in 2016.
The only large land area with below-average temperatures was in South America and included parts of Argentina, Paraguay and Bolivia.
In parts of Arctic Russia, temperatures soared 6 to 7 degrees above the long-term average. Many other Arctic and sub-Arctic regions in Russia, Alaska and northwest Canada were at least 3 degrees above average.
“We are used to measuring temperature records in fractions of a degree, and so this is different,” said Petteri Taalas, the WMO’s secretary-general.
What kind of effects is this having?
To better answer that question, the WMO took a look at climate patterns over the last five years. What it found was a lot of hot and wild weather.
The period from 2011 to 2015 was the hottest five years on record, the report said. Sea levels are rising and ice is melting. So-called “once in a generation” heat waves and flooding are becoming more common.
The cost in terms of lives and livelihoods is staggering.
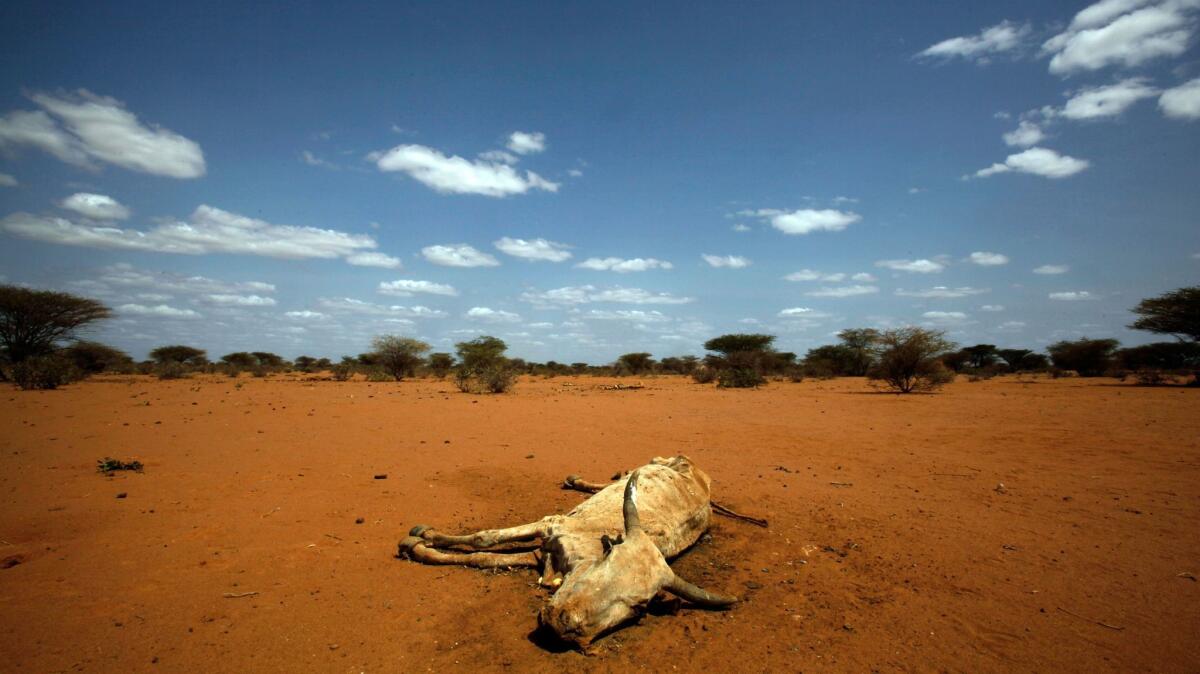
- The United Nations attributes 258,000 deaths to the drought in East Africa from 2010 to 2012.
- Hurricane Sandy in 2012 resulted in an estimated $67 billion in economic losses in the United States.
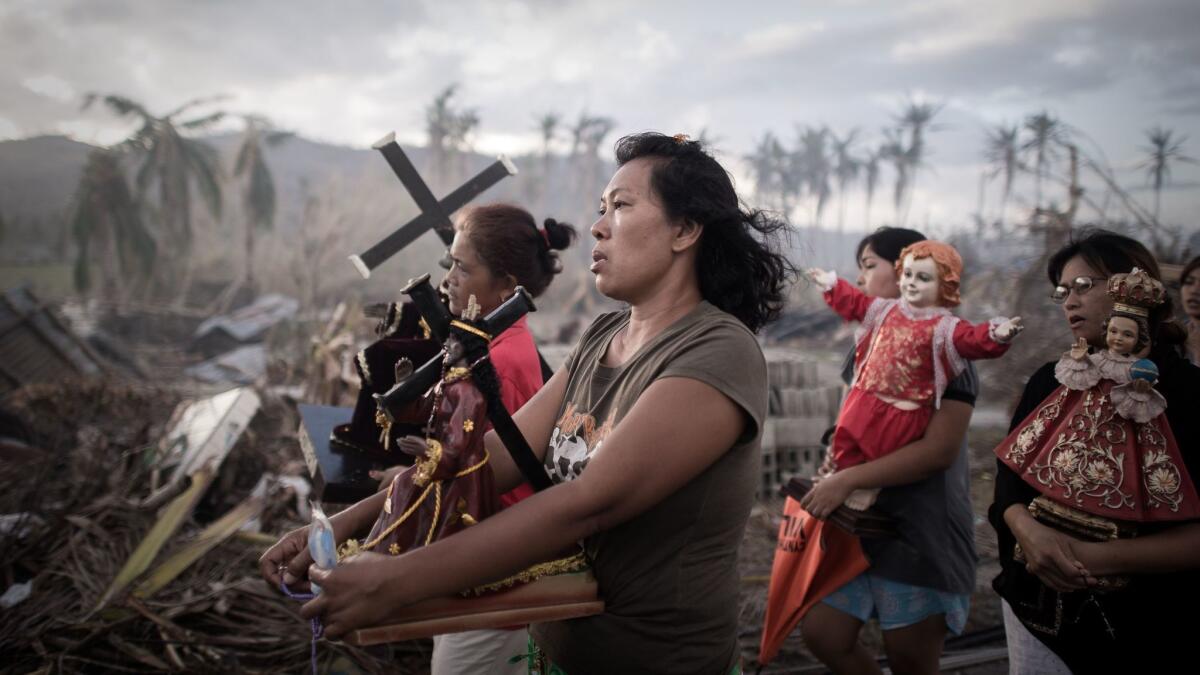
- Typhoon Haiyan claimed 7,800 lives in the Philippines in 2013.
- Weather-related hazards drove more than 15 million people from their homes in 2015, according to U.N. estimates.

So too are the environmental effects:
- The Arctic sea-ice span from 2011 to 2015 was 28% below the 1981-2010 period. For much of the last five years, however, the Antarctic sea-ice span was above the 1981-2010 period.
- Sea levels have risen about 3 mm a year since 1993, compared with an average of 1.7 mm a year from 1900 to 2010.
- There was significant coral bleaching in some tropical waters, with coral mortality of up to 50% reported in parts of the Great Barrier Reef in 2016.
How much of a role is human-induced climate change playing?
While this is hard to quantify, the WMO report found that many extreme weather events over the last five years were made a lot more likely as a result of man-made climate change — in the case of some warming, by a factor of 10 or more.
Of the 79 studies published by the Bulletin of the American Meteorological Society on extreme weather events from 2011 to 2015, more than half cited human-induced climate change as a contributing factor, the report said
Examples include the record high temperatures in the United States in 2012, in Australia in 2013 and in Europe in 2014.
But in the case of extreme rainfall, including the 2011 flooding in South East Asia, the report did not find a strong link to climate change.
You said there was good news?
The Global Carbon Project reports that carbon emissions were flat in 2014 and 2015 and are projected to grow by just 0.2% in 2016.
Moreover, this leveling off at about 36 billion metric tons occurred at a time of steady economic growth, which has typically been associated with higher emissions.
The authors of the study, published in the journal Earth System Science Data, attributed the slowdown primarily to declining coal use in China and the United States, the world’s biggest polluters.
But they cautioned that it was too soon to say whether emissions have peaked, which will need to happen soon if there is to be any hope of achieving the temperature targets in the Paris agreement.
Even if emissions have stabilized in some places, growth in others could push global levels back up again. India, for example, saw its emissions grow by more than 5% in 2015.
Still, scientists said the findings are reason to remain optimistic that it will be possible to reverse the trend of dramatic global emissions growth in recent years.
“Deep changes in the climate system are taking place,” said Jan Fuglestvedt of the Center for International Climate and Environmental Research in Oslo. “It’s important not to get used to this trend of new records all the time.”
Twitter: @alexzavis
Special correspondent Mythili Sampathkumar contributed to this report from Marrakech, Morocco.
More to Read
Sign up for Essential California
The most important California stories and recommendations in your inbox every morning.
You may occasionally receive promotional content from the Los Angeles Times.


