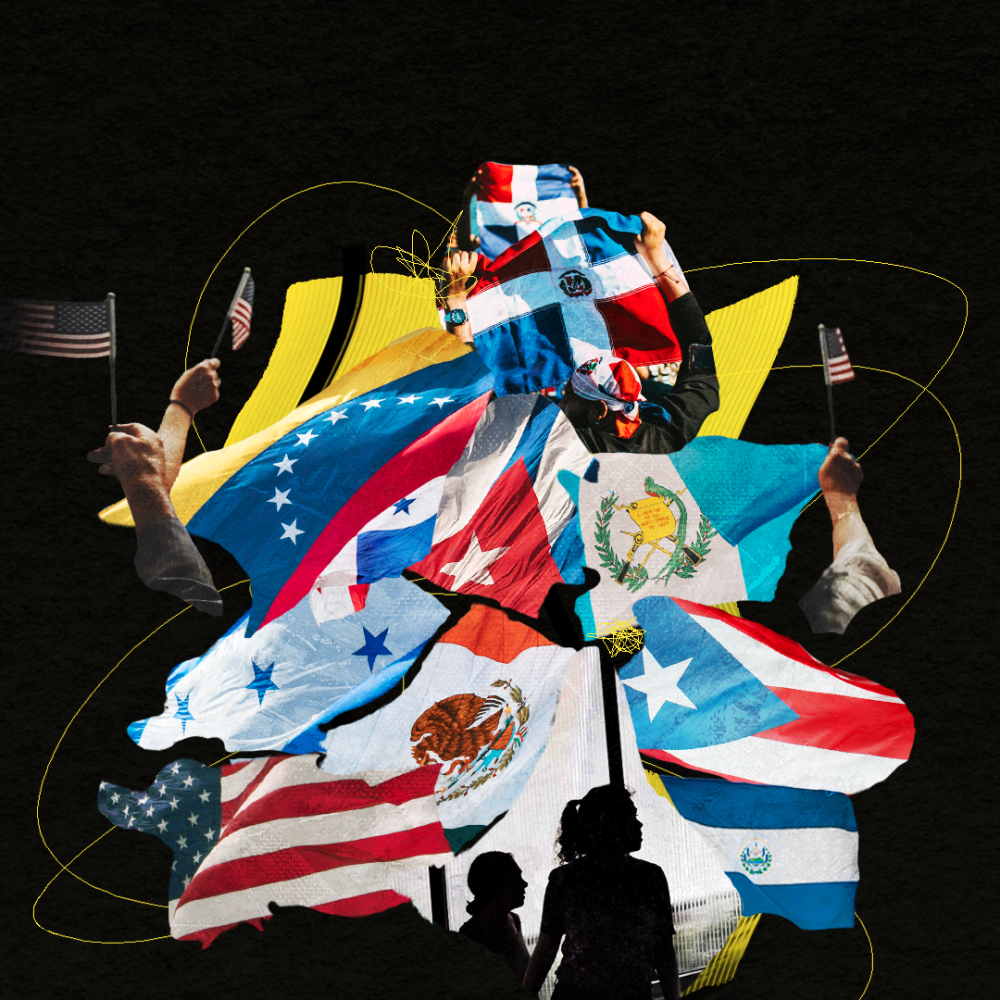
Increasing shares of Latinos in the United States speak English proficiently, have gained U.S. citizenship and have lived in the country for at least a decade, according to a new Pew Research Center analysis.
As patterns of immigration from Latin America change, Venezuelans have now become the fastest-growing Latino group in the U.S., according to the report, which also noted that immigrants make up a declining share of Latinos in the country.
Toxic gratitude or ‘Si Dios Quiere Syndrome’ is the concept that Latinos are too content with just receiving scraps instead of demanding what they deserve.
“While immigration is still an important part of the nation’s Latino story, the share of the Latino population that was born outside the United States is in decline, and it is really births to U.S. Hispanic parents in the United States that is now driving that population growth,” said Mark Hugo Lopez, director of race and ethnicity research at the Pew Research Center.
Between 2010 and 2021, the Venezuelan population in the U.S. increased by 169%, from roughly 240,000 to 640,000, researchers found.. Dominicans and Guatemalans followed with growth rates of 60% each.
While Mexicans remain the largest Latino origin group, they had the slowest growth rate — 13%.
Los Angeles poet Yesika Salgado curates the first De Los Latino poetry series where poets explore the theme of belonging.
Lopez noted that it has become harder to enter the U.S. despite recent increases in asylum-seekers being apprehended at the U.S.-Mexico border. Many of them are not Mexicans, he said.
“Part of this may also be that people are returning to Mexico in order to retire,” Lopez said.
The five largest Latino populations in the U.S. by origin group, according to Pew, were Mexicans (37.2 million), Puerto Ricans (5.8 million), Salvadorans (2.5 million), Dominicans (2.4 million) and Cubans (2.4 million).
The Pew analysis — based primarily on data from the U.S. Census Bureau’s 2021 American Community Survey — shows that about 32% of all U.S. Latinos were immigrants in 2021, down from 37% in 2010.
Lopez said it’s important to better grasp the diversity of Latinos in the U.S. and understand that not all Latino people “necessarily share the same point of view.”
When it comes to elections, for example, “they may not necessarily appear as a strong voting bloc, but instead may vote in different ways depending on the parts of the country that you look at,” Lopez said.
Homeownership rates, household incomes and the attainment of U.S. citizenship and bachelor degrees vary among different Latino groups.
In 2021, about 81% of Latinos living in the country were U.S. citizens, up from 74% in 2010.
Spaniards (95%), Panamanians (90%), Cubans (82%) and Mexicans (81%) have some of the highest citizenship rates, according to Pew. Hondurans and Venezuelans have the lowest rates, at 51% each.
The Spaniard category includes recently-arrived immigrants from Spain and Spanish immigrants’ children born in the United States. Lopez said the category also includes people in areas such as New Mexico, Colorado and West Texas who say they have a Spanish background.
U.S. citizens include people born in the U.S. and its territories (including Puerto Rico), people born abroad to American parents, and naturalized immigrants, Pew noted.
Additionally, nearly 80% of Latino immigrants have lived in the U.S. for more than 10 years, up from 64% in 2010, the researchers found. Panamanian and Mexican immigrants are the most likely to have lived in the U.S. for more than a decade.
When it comes to higher education, Venezuelans (57%) and Argentinians (46%) had the highest shares of people 25 and older with a bachelor’s or more advanced degree. Guatemalans (11%) and Salvadorans (13%) had the lowest shares.
Lopez points to the 15% of Mexican adults in the same age group with a degree. Compared with Venezuelans, “that’s a pretty big difference,” Lopez said, “especially given that the Mexican origin population is by far the biggest.”
“It’s the immigrants from Venezuela, who are coming to the U.S., those who are able to come to the U.S. to make that journey, oftentimes, may have more resources at their disposal,” Lopez said. “They have a college degree or an advanced degree already when they arrived in the United States.”
“That seems to be part of the story,” he said.
When looking at median household income, Argentinians were found to have the highest at $80,000, while Hondurans and Dominicans had the lowest at $50,000 each.
Similarly, Latinos with the highest homeownership rates in 2021 were Spaniards (63%) and Argentinians (62%), compared to Dominicans (31%) and Hondurans (31%), the groups with the lowest rates of homeownership.
Language adds another layer to the diversity of the Latino population.
In 2021, Spaniards (95%), Panamanians (87%) and Puerto Ricans (83%) had the highest shares of English proficiency. Hondurans (47%), Guatemalans (51%), Venezuelans (56%) and Salvadorans (56%) had the lowest.
Overall, 72% of U.S. Latinos age 5 and older either spoke only English at home or spoke English very well, up from 65% in 2010.
During this time frame, both U.S.-born and immigrant Latinos became more proficient in the language, Pew found.
The share of U.S.-born Latinos who were proficient in English grew from 88% to 91%, and the share among immigrant Latinos grew from 32% to 38%.
More to Read
The Latinx experience chronicled
Get the Latinx Files newsletter for stories that capture the multitudes within our communities.
You may occasionally receive promotional content from the Los Angeles Times.


