Census reports declining population on L.A.’s Eastside, fueling undercount fears
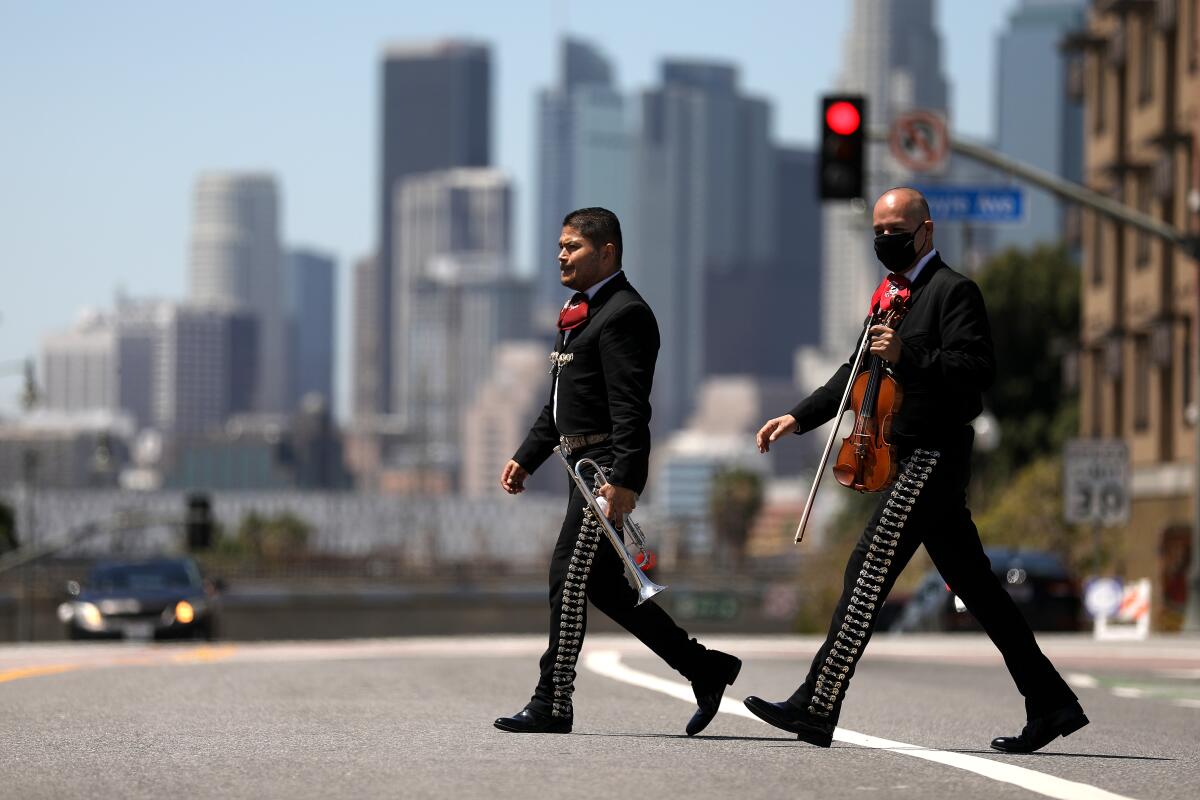
Over the last two years, politicians, civic leaders and community activists across Los Angeles worried that Latinos would not be properly counted as part of the U.S. Census Bureau’s once-in-a-decade population survey.
Amid the COVID-19 pandemic, city and county officials sent volunteers to knock on doors, staged “pop-up” sites to help people with their forms and provided goody bags to those who successfully turned in their information.
L.A.’s neighborhood numbers have finally come out, as part of the city’s process for redrawing the boundaries of its 15 City Council districts. And some at City Hall are disappointed with the results.
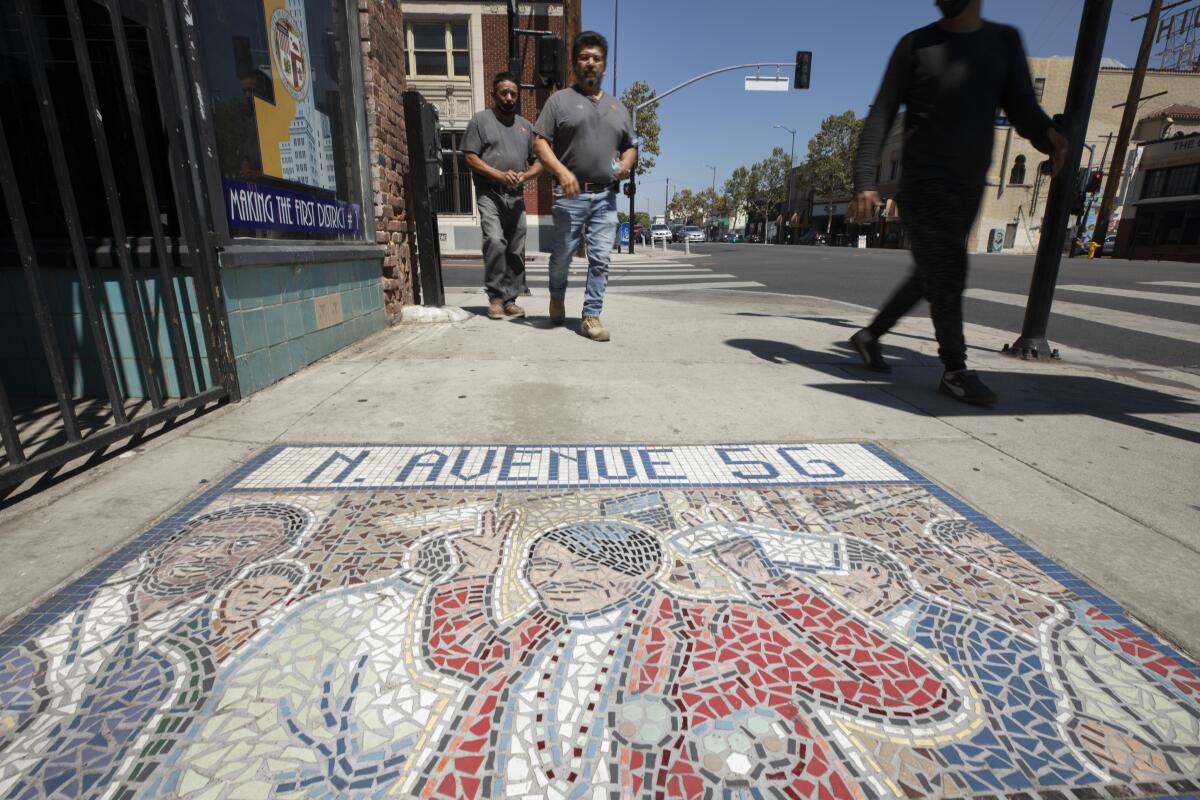
Highland Park, a neighborhood on the city’s northeast end, recorded a decline in population of more than 3,900 people between 2010 and 2020, according to census figures released by the city’s Redistricting Commission. The Eastside neighborhood of Boyle Heights fell by 3,300. And Cypress Park showed a decrease of about 1,250, or 13% — the largest of any L.A. neighborhood.
In the west San Fernando Valley, the opposite phenomenon played out, with Northridge adding 3,400 people and Chatsworth taking on 6,000. Woodland Hills recorded an additional 8,200 people — a 13% increase, according to the Redistricting Commission.
“Our worst fears have been realized, in a sense, with a poor-quality count primarily in Latino-majority areas in the Eastside of the city,” said David Ely, a demographic consultant with the Redistricting Commission.
That disparity — declining population numbers on the Eastside and major increases in the West Valley — will present challenges for the redistricting panel, which will devote the next two months to creating new maps for the City Council’s 15 districts. Each district must have roughly the same number of people, which means some will need to add population, and others will need to shed.
The process will have implications for the type of representation residents receive at City Hall.
Changes to district boundary lines could cause some neighborhoods to wind up with a different council member. And if one council district is redrawn, the domino effect would ensure that the boundaries of nearby districts are reworked as well.
The process also could have consequences for people running in the June 2022 council election, when eight seats will be up for grabs. If boundary lines change dramatically, any number of candidates could find themselves living in a different council district — one that does not have an election scheduled for next year.
The Redistricting Commission, made up of political appointees at City Hall, must submit its proposed maps to the City Council on Oct. 29. Under the law, each district must have about 260,000 residents or hew relatively close to that figure.
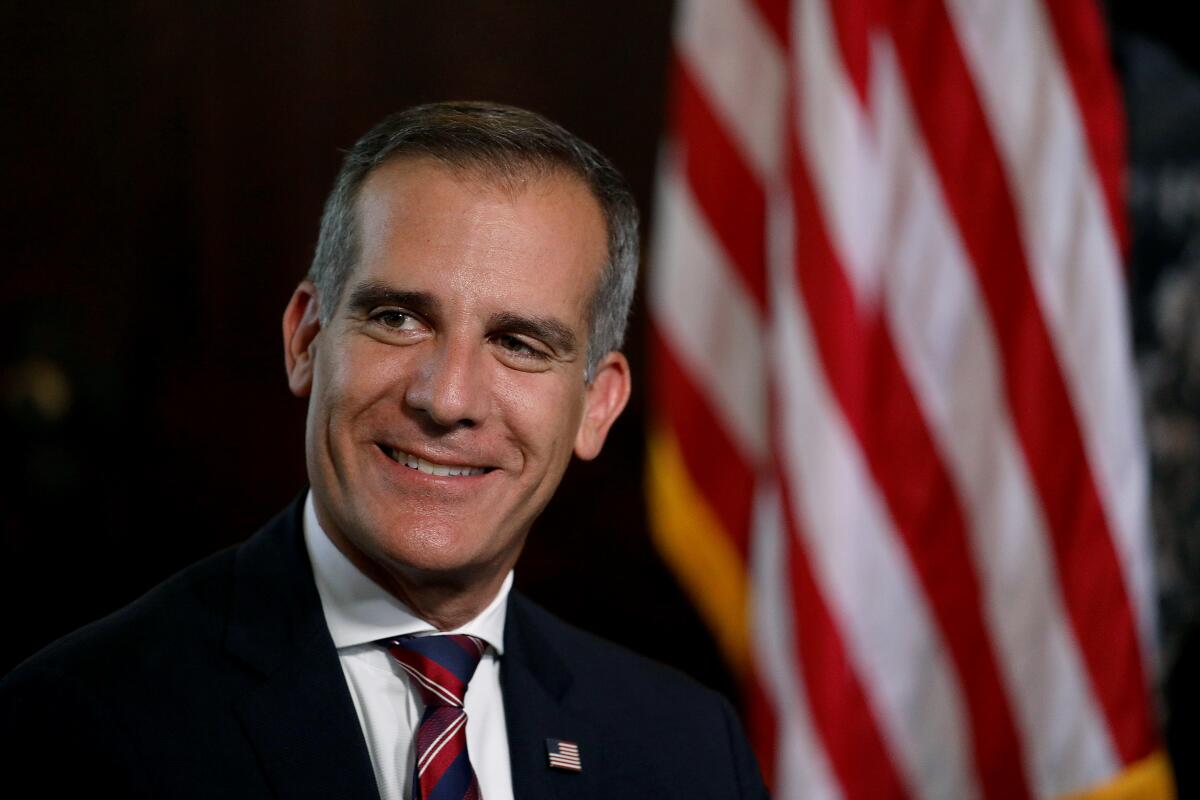
In an interview, Mayor Eric Garcetti defended the city’s work in getting residents to turn in their forms, saying outreach workers did “a hell of a job,” given the pandemic and other challenges. Garcetti said the Trump administration provided few resources and pushed repeatedly for census forms to include a question about residents’ citizenship status — a move the mayor called “reprehensible.”
“We never faced this sort of hostile headwinds, the politicization of what has traditionally been the most nonpartisan obligation of government: to count its people,” he said.
Representatives of former President Trump did not respond to inquiries from The Times.
An official with the Census Bureau said the agency took steps to inform the public about its survey, producing advertising in multiple languages, teaming up with community groups and extending the data collection process by more than two months to give households additional time to respond.
“Despite facing a pandemic, natural disasters and other unforeseen challenges, the 2020 census results thus far are in line with overall benchmarks,” the agency said in a statement.
The Census Bureau has a process for government agencies to seek additional review of results if they believe there were inaccuracies, such as missing street addresses. The bureau will begin accepting cases in January — after L.A.’s new district boundaries have gone into effect.
Redistricting Commissioner Richard Polanco, who was appointed to represent Lincoln Heights, Chinatown, Mount Washington and other neighborhoods, said he’s convinced that L.A.’s census results are inaccurate. Nevertheless, the city is legally obligated to use those numbers, he said.
The commission can address some of the disparity, Polanco said, by drawing maps with a variation of up to 10% between the city’s most and least populous districts. The panel has requested an analysis to determine the extent of the undercount, he said.
“We’re going to listen very carefully to the consultants and to the community and to the data,” said Polanco, a former state senator.
Paul Ong, a research professor at the UCLA Luskin School of Public Affairs, said the undercount in Los Angeles County affected not just Latinos but also Asian and Black Americans; it generally also affected renters and low-income households. An undercount was most likely in neighborhoods that have a high percentage of people living in poverty and a large share of Latinos who are not citizens, he said.
Ong, who co-wrote an analysis of the undercount, attributed the phenomenon partly to the disruption caused by the pandemic. He also drew a connection between the lower numbers and Trump’s push for a citizenship question.
“Although the effort was unsuccessful, it nonetheless created fear among immigrants, both legal and undocumented,” he wrote in his analysis, which was co-written by researcher Jonathan Ong.
Overall, L.A. experienced a 2.8% population growth over the last decade, bringing its total to 3,898,725, according to the commission’s report. Playa Vista, the mega-development on the Westside that is now a full-fledged neighborhood, saw the biggest increase — 90% — as it took on an additional 7,200 people.
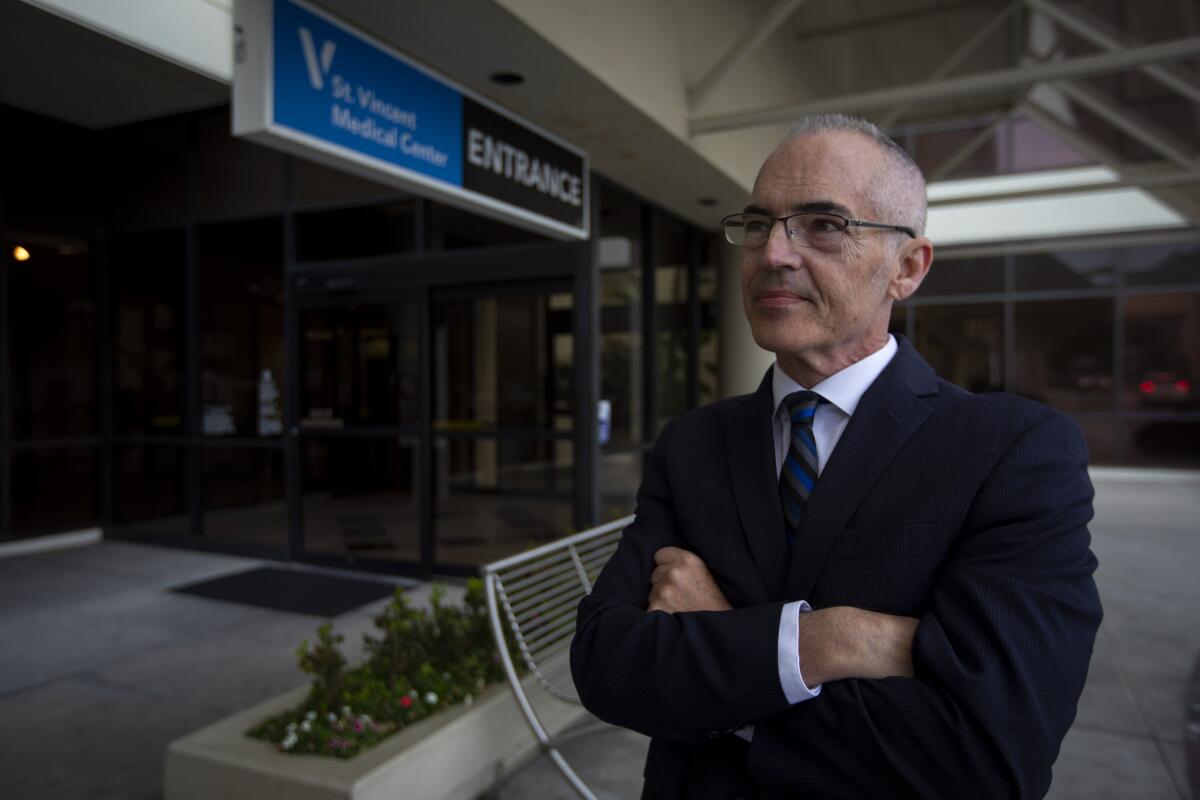
In raw numbers, the largest jump in population could be found downtown, which added 24,000 people, for an increase of 57%, according to the commission’s analysis. The growth downtown offset declines in other parts of the 14th District, which is represented by Councilman Kevin de León and includes such Eastside communities as El Sereno and Boyle Heights.
In the West Valley, two council districts represented by Councilmen Bob Blumenfield and John Lee had a combined increase of more than 30,000 people between 2010 and 2020, the city’s analysis found.
Meanwhile, two council districts that stretch from Hollywood to Highland Park recorded a decrease of more than 18,000 people. Those areas, represented by Councilmen Mitch O’Farrell and Gil Cedillo, include neighborhoods where home prices have soared and upscale businesses have moved in.
O’Farrell’s council district, which includes Echo Park, Silver Lake and Atwater Village, registered the biggest decrease in population: 5.1%. Nevertheless, he said, he doubts that the decrease was due to gentrification, the process through which low-income residents are priced out of a neighborhood and more affluent people move in.
O’Farrell said more than 2,000 units of affordable housing were permitted by the city in his district over the last decade — second only to Cedillo’s district, which stretches from Westlake to Highland Park. Cedillo’s district permitted more than 2,400 units of affordable housing, according to Los Angeles Department of City Planning figures.
O’Farrell attributed the decrease to Trump’s “reign of terror” against residents in the country illegally. Cedillo took a similar stance, saying the weak response to the census was due to the former president’s push to make immigration status a part of the survey and to deportation fears among some of his constituents.
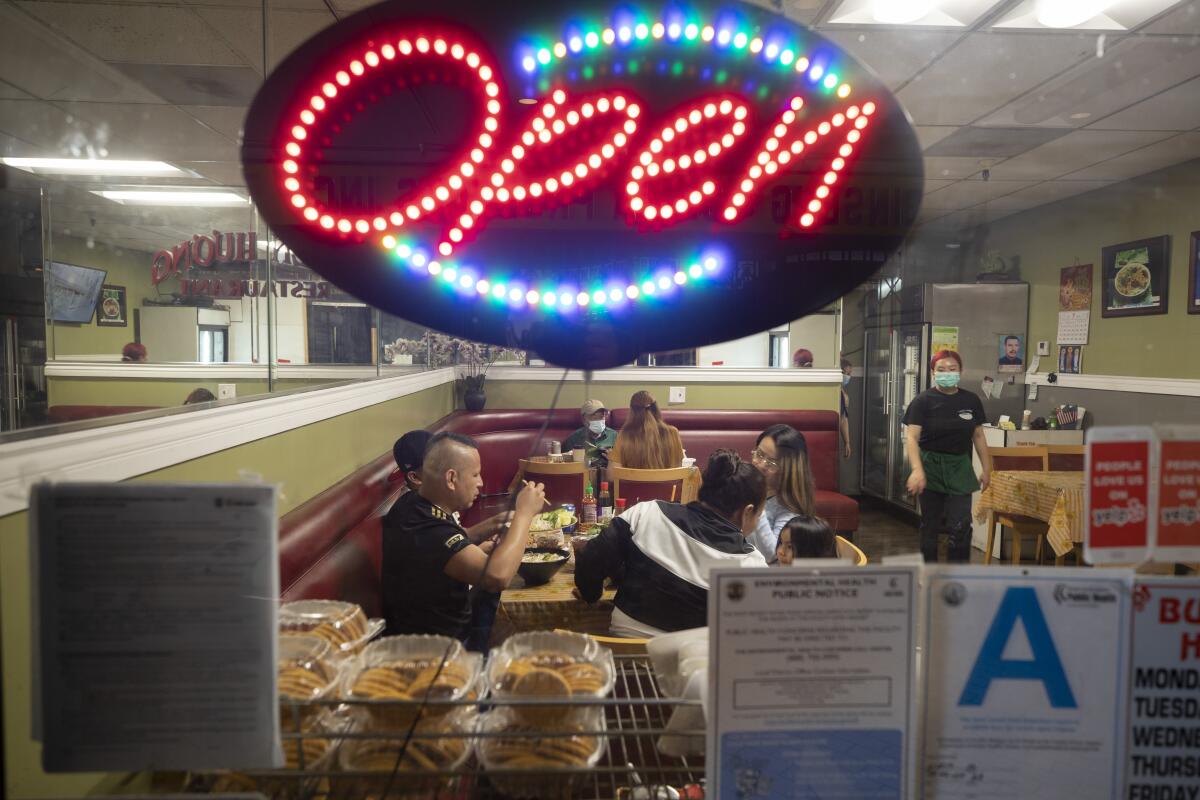
One tenant rights activist agreed that Trump had an effect on the count. But she argued that gentrification also played a part, with large families being replaced in certain neighborhoods by smaller, wealthier households.
“In our collective experience, gentrification does play a role,” said Annie Shaw, an organizer with Chinatown Community for Equitable Development, an anti-eviction group. “We’ve had tenants who’ve had to leave because of rent increases and the lack of rent-control protections.”
Chinatown and the tiny neighborhood of Solano Canyon, both in Cedillo’s district, saw a combined 9% decrease in population, according to Redistricting Commission figures. Not far away, Lincoln Heights and El Sereno both recorded a decrease of 4%.
The council must vote on the maps before the end of the year. The new boundaries go into effect Jan. 1.
Times staff writer Dakota Smith contributed to this report.
More to Read
Sign up for Essential California
The most important California stories and recommendations in your inbox every morning.
You may occasionally receive promotional content from the Los Angeles Times.

